)
FlowViz for Bildr
Bildr is a low-code tool for building web applications and browser extensions. One of the things it is missing though, is a graphical representation of the inter-connected flows and actions that you can set up in your app. FlowViz is my attempt to add this feature. In this post, I will show my progress thus far in version 0.1.2
Background
Bildr is a low-code tool for building web applications and browser extensions. One of the things it is missing at the moment though, is a graphical overview of the flows and actions that you set up in response to page and user events in the app you are building. Such UIs are available in other tools like AppGyver, Node-Red and n8n. And once you have worked with one of these, it is very arduous to think in any other way about flows and actions.
Of course, a visualization UI for flows and actions is very much an optional feature. Bildr doesn't need them at all. You can create all the flows and actions you need without such an overview, but eventually you get to a point where your flows are just too big, too complex to keep in your head. As an example, where does this flow go from this API action upon success? What happens when it gets there? I don't want to leave my current changes, but I do need to see what actions are downstream, outside the current flow based on nested flows or action-sourced flows, etc.
Seeing all the interconnections and conditional branching based on variables, or success/failure inside existing actions allows for quick refresh on what is going overall in response to user events, or page load. FlowViz is my attempt to solve this issue by creating a visualization of all of a page's flows, showing how they interconnect, and eventually, allowing you to make changes without leaving this graphical overview.
This wouldn't be possible without access to the internal data structure of both Bildr Studio and that of the project you are currently building in the Studio. It is so rare to find an app written this way! Bildr Studio is written with Bildr Studio! Big kudos to the Bildr team for their openness and forward-thinking!
Current Version: 0.1.2
Status
I have been working on the Bildr Object Model (BOM - my way of thinking about it) and it's workings and writing the basic processor for taking what is stored in the BOM with respect to flows and actions and rendering that graphically. So what follows is the state of FlowViz by way of a non-trivial example.
The Example Flow
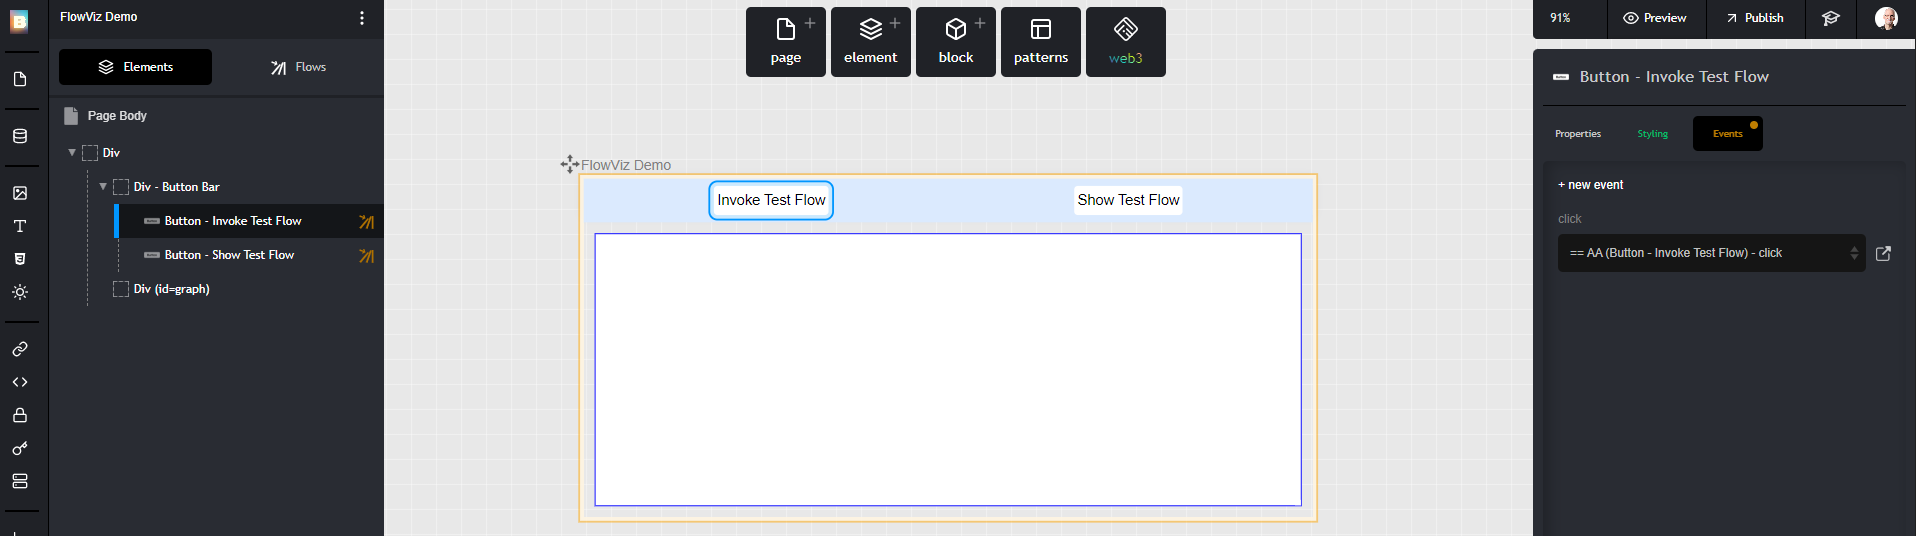
Figure 1 shows the Bildr Studio with the FlowVizDemo page loaded. The page is simple. It has 2 buttons and a div. The button on the left, "Invoke Test Flow", has a click event that invokes the flow we are going to be plotting. The other button, "Show Test Flow", invokes another flow with a single action "Run JavaScript function v2" that maps the overall flow from the "Invoke Test Flow" button's click event and plots its findings into the div at the bottom of the page.
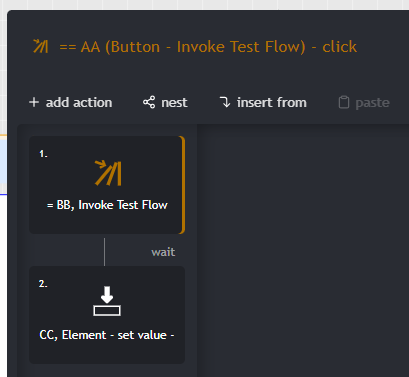
Figure 2 shows the actions of the (AA...) flow that is called from the "Invoke Test Flow" button's click event. Note that there is a "wait" directive between the nested flow action and the action following it. This means (in my understanding) that the entire nested flow will run, and when complete, will return to this flow to further execute actions lower down in the list. Note also, that there are no details for a nested flow. You click on that UI element and the Studio replaces the UI in that part of the page with the destination flow's data/presentation (see Figure 3) below.
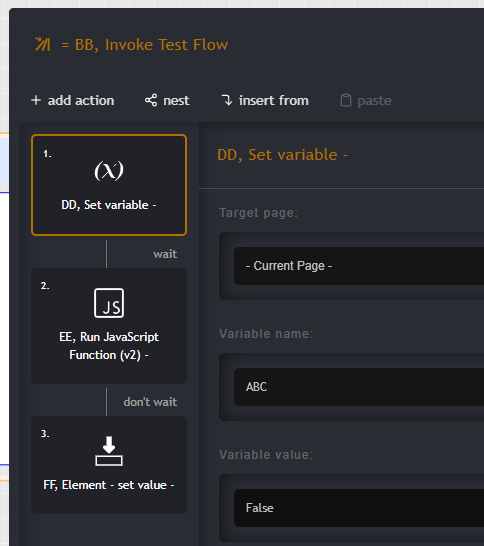
Figure 3 shows the sequence of actions that are the "BB...". Note that there is a "wait" directive between actions (DD...) and (EE...). I haven't shown the UI contents of each action as they are not doing anything material (yet).
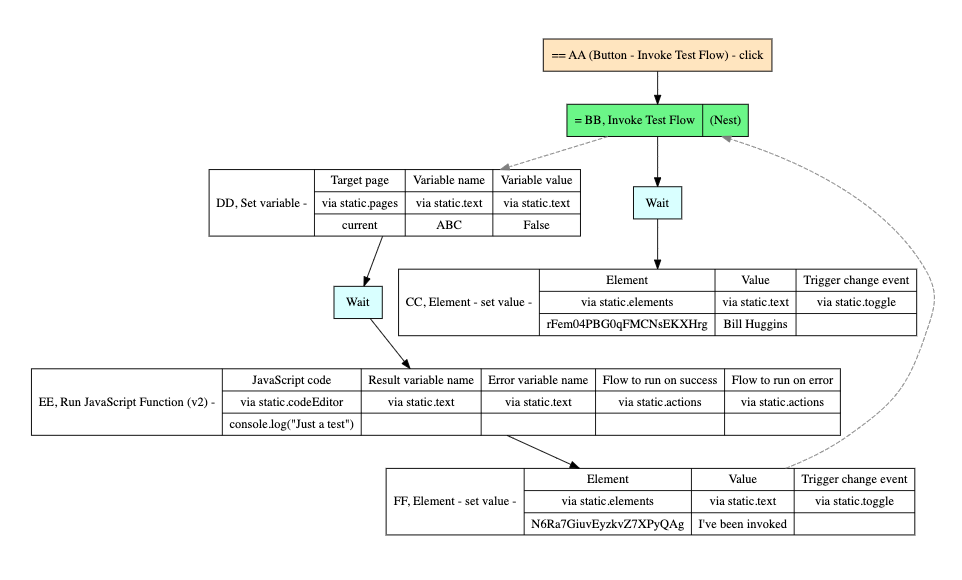
Figure 4 shows the result of running the JavaScript function using the event (AA...) as a starting point. All of the non-actions in the flow are shown with coloured backgrounds for reference. The solid arrows show the top-down, implied sequence of the actions as rendered by the Studio. The dashed arrows represent an implied "jump" to a nested flow. If the nested flow is followed by the "wait" directive (as is the case here with BB), then there is an implied return "jump back" to the calling point shown as another dashed arrow.
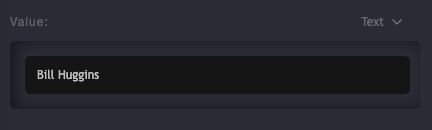
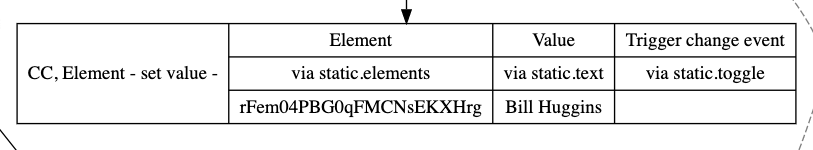
Note that for each regular action, FlowViz plots the action's label to the left and its settings to the right (Figures 5b, 6b). The settings section is divided into 3 rows. The top row shows the parameter's label as shown in the Studio UI. The second row shows the sub-specifier/context where that label will present it's choices from. So far, the BOM reveals these in the text format of "static.---" . The 3rd row shows whatever choice you selected. If you did not make a selection for that particular parameter, then the default value (often blank in the UI) is shown.
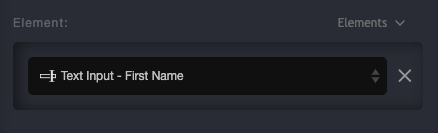
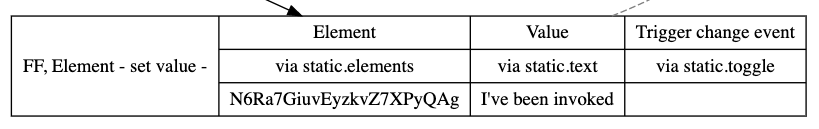
Also note that in some types of context, like "Elements" above, what is shown in the Bildr UI is the Label associated with the element rather than the element's ID as I have shown it. I will be making the visualization more detailed to reflect this same translation in an upcoming release.
A Note about action execution order and timing
At this point in my exploration into the internals of the BOM, it is not clear how multiple actions within a single flow are timed. When do they start? How do they end in relation to the way they are shown in the Studio UI?
Note: for the next few paragraphs, consider the actions you see in the Bildr UI to be a collection of parameters and helpers that result in data that are passed to pre-made JavaScript functions created by Bildr that run inside the browser. This is one way that NoCode and LowCode tools work under-the-hood. And though possibly incorrect here, it shows the thinking process I am using.
For example, in JavaScript, if you have functions that may take a long time (relatively speaking) to execute you can execute them in order (synchronously), but this causes your app to become momentarily unresponsive for the time taken by the function. For example, API calls can take a while to return. Your users can do nothing but wait. Clicking will not work until the synchronous API call completes. The solution in coded environments is to use asynchronous functions which execute their target functions in parallel and return control back to your app right away. In these cases, any subsequent function calls can be told to "wait" for the primary function to complete before they execute. And so on. All of it without affecting what users can do with your app's UI.
Another technique, and one that I have heard referenced in 'Bildr Office Hours' and the prior 'Bildr Hour', is the technique of a queue. With a queue, functions intended to be executed are placed in an array (or similar) and a separate function executes each queued function in order. As each function completes, it is removed from the queue. The key here is whether the functions themselves are run synchronously or asynchronously. Synchronously-run functions can affect the user experience as already mentioned. Asynchronous functions will not. But if you use a queue for asynchronous functions, there is the issue of when the individual functions complete in relation to others. A long-running function that executes first will not complete before a short-running function started 2nd. As you can see it can get quite involved.
There is an explanation in a recent 'Bildr Office Hours' about how actions in sequence in the Studio UI are enacted by Bildr inside the browser, if you are interested (https://www.youtube.com/watch?v=aMYD4LJIWwg at 00:32:26). I will have to re-watch that this episode as well.
It's entirely possible I have this all wrong, but it is fun (for me, at least) trying to understand what is going on this using the data provided in the BOM and trial and error.
I am most interested in learning exactly how action execution happens, as it will make a big difference in how the FlowViz should be render/interpret arrows. For now, I am following the implied, top-down UI sequence of actions within flows and acommodating any subsequent wait directives.
Where is this going?
For now, I have been working on decoding the rich information found inside the BOM as it pertains to actions and flows. Some effort was needed to handle the recursion within the BOM. Next came the need to auto-route the arrows between flows and handle the implications of "wait" directives visually, so that the resulting plot was dynamic (more on how I did that in the next writeup). Unfortunately, I haven't given much attention to the visual presentation of the flows and actions. I hope to fix that very soon.
After that, I hope to be implementing click event handlers and hover handlers on the plot elements themselves and either call up the associated Studio UI for making changes, or better, offer an alternate UI to make those changes from modals/lightboxes with the needed forms.
Happy Bildr-ing